In seiner Funktionalität auf die Lehre in gestalterischen Studiengängen zugeschnitten... Schnittstelle für die moderne Lehre

Eingabe/Ausgabe 14/15
In diesem Kurs setze ich mich viel mit generativer Gestaltung und der Gestaltung von Daten auseinander. Für mich war dieser Kurs auch der erste Kontakt zum programmieren.
Generatives Gestalten mit Processing und der Erste Kontakt mit Algorithmen
In the first part of the course we learned what algorythms are, and how they are structured. We also learned the basics of the programming language Processing and lerned what generative Design is.
IDEA
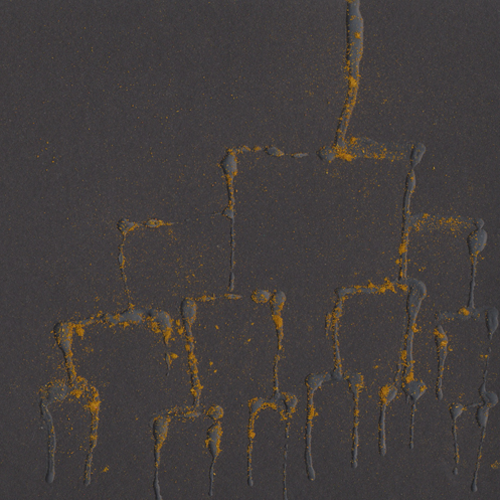
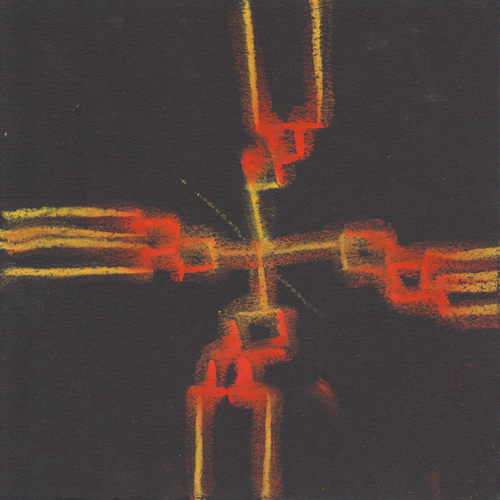
Our first contact with Programming language we got with the language we already learned: Our own verbal language. The exercise was to simply (or event harder then thought) formulate an algorythm that later had to be solved by the coursemates. After several changes in details and complexity the final code looked like this (german):
1. Wähle eine Farbe danach, wie warm du dich im Moment fühlst (zB. eine warme Farbe, Orange oder Gelb, wenn es dir Wohlig warm ist)
2. Male damit einen Punkt in die Mitte des Blattes
3. Ziehe von diesem Punkt vier 1,5 cm lange, Linien nach oben, nach unten, nach rechts und nach links.
4. Zeichne an das Ende der Linien eine weitere Linie, die im 90 Gradwinkel nach rechts und nach links verläuft.
5. Wenn du lieber im Süden Urlaub machen würdest, als im Norden, wähle nun die nächst wärmere Farbe der Kreiden, sonst die nächst kühlere
6. Zeichne mit dieser Farbe 8 neue Linien mit ca. 1 cm Länge an die  Enden deines Konstruktes, wobei diese in Richtung des nächsten Blattrandes verlaufen.
7. Du hast jetzt 8 Enden.
8. Schaue auf die Uhr.
    - Wenn es vor 12 Uhr ist, zeichne von jedem Ende eine Linie nach links.
    - Wenn es zwischen 12 und 16 Uhr ist, zeichne Linien nach rechts und nach Links
    - Wenn es nach 16 Uhr ist, zeichne eine Linie nach rechts
9. Schaue auf die Farbe deines Oberteils. Wenn du sie als kühl empfindest, nehme den nächst wärmeren Farbton der Kreiden. Wenn du die Farbe als warm empfindest, nehme den nächst kühleren Farbton
10. Zeichne mit diesen wieder Linien mit ca 1cm von den Enden in Richtung Blattrand
11. Wenn du jetzt 8 Enden hast, ziehe von jedem ende einen strich nach rechts und nach links. Wenn du 16 Enden hast kannst du wählen: Ziehe einen Strich nach rechts, nach links oder nach rechts und links.
12. Nehme die Farbe, die dir am besten gefällt. Zeichne damit  nun wieder von den Enden ausgehend Linien zum Blattrand. Mache sie so lange, bis du den Blattrand erreichst.
13. Fahre beginnend in der Mitte jeden Strang mit dem Finger nach, und verschmiere die Kreide so ein wenig.
14. Vielen Dank für deine Hilfe!
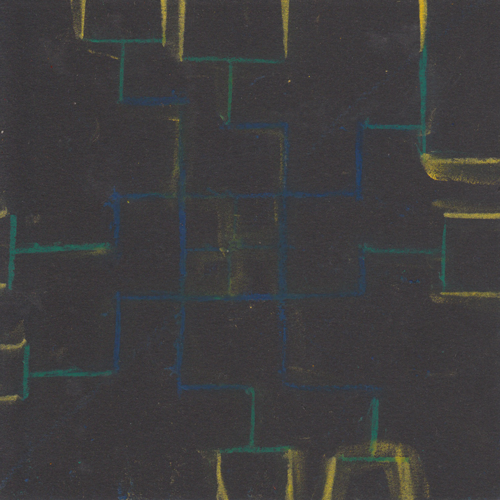
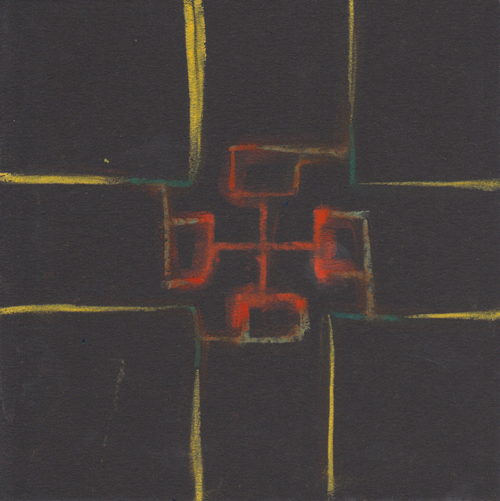
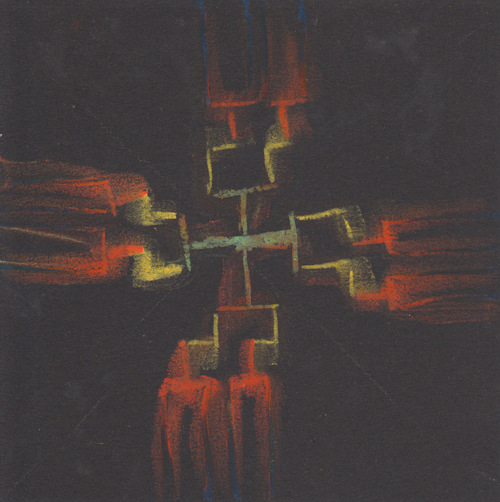
Results:
REALISATION - Software
The next exercise was to translate ower human code into processing. Fabian Moron Zirfás, our tutor, gave us some basics and much help.
I really was pretty confident with myself, because processing was the first programming language I ever used at this moment, and I was happy to see, that I could at least do something with it, even if it was far away, from what I wanted to do. After some hours of pure processing practise, I decided to look for a way to translate my human code into processing. I built some Versions with Recursion with the help of the book „Generative Gestaltung“ of Hartmut Bohnacker, Benedikt Groß and Julia Laub.
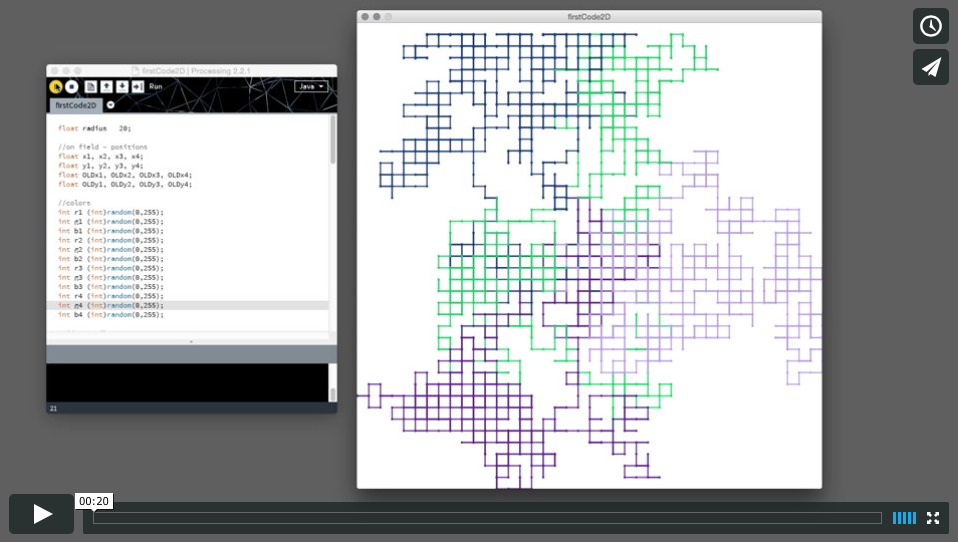
On my way towards goal I found a really nice Idea, which I prefered compared to the Recursion-Version of my code: A straight line would run over the screen, it would always „stop“ after a certain length, choose a random direction in the angle of 90° including the one it came from, and then go on towards this direction.
My first code looked like this:
  float radius = 20;

  //on field - positions
  float x1, x2, x3, x4;
  float y1, y2, y3, y4;
  float OLDx1, OLDx2, OLDx3, OLDx4;
  float OLDy1, OLDy2, OLDy3, OLDy4;

  //colors
  int r1=(int)random(0,255);
  int g1=(int)random(0,255);
  int b1=(int)random(0,255);
  int r2=(int)random(0,255);
  int g2=(int)random(0,255);
  int b2=(int)random(0,255);
  int r3=(int)random(0,255);
  int g3=(int)random(0,255);
  int b3=(int)random(0,255);
  int r4=(int)random(0,255);
  int g4=(int)random(0,255);
  int b4=(int)random(0,255);

  void setup(){
  size(800,800);
  background(255);
  x1 = x2 = x3 = x4 = width/2;
  y1 = y2 = y3 = y4 = height/2;
  OLDx1 = OLDx2 = OLDx3 = OLDx4 = x1;
  OLDy1 = OLDy2 = OLDy3 = OLDy4 = y1;
  frameRate(60);
  }

  void draw()
  {
  //define new angle
  float angle =(TWO_PI/4) * floor(random(-4,4));
  x1 += cos(angle)*radius;
  y1 += sin(angle)* radius;
  angle =(TWO_PI/4) * floor(random(-4,4));
  x2 += cos(angle)*radius;
  y2 += sin(angle)* radius;
  angle =(TWO_PI/4) * floor(random(-4,4));
  x3 += cos(angle)*radius;
  y3 += sin(angle)* radius;
  angle =(TWO_PI/4) * floor(random(-4,4));
  x4 += cos(angle)*radius;
  y4 += sin(angle)* radius;

  //prohibit offscreen points
  if (x1<0 || x1>width || y1<0 || y1>width){
  x1 = OLDx1;
  y1 = OLDy1;
  }
  if (x2<0 || x2>width || y2<0 || y2>width){
  x2 = OLDx2;
  y2 = OLDy2;
  }
  if (x3<0 || x3>width || y3<0 || y3>width){
  x3 = OLDx3;
  y3 = OLDy3;
  }
  if (x4<0 || x4>width || y4<0 || y4>width){
  x4 = OLDx4;
  y4 = OLDy4;
  }

   //set angle points
  strokeWeight(4);
  stroke(r1, g1, b1);
  point(x1,y1);
  stroke(r2, g2, b2);
  point(x2,y2);
  stroke(r3, g3, b3);
  point(x3,y3);
  stroke(r4, g4, b4);
  point(x4,y4);

  //draw lines
  strokeWeight(2);
  stroke(r1, g1, b1);
  line(x1,y1,OLDx1, OLDy1);
  stroke(r2, g2, b2);
  line(x2,y2,OLDx2, OLDy2);
  stroke(r3, g3, b3);
  line(x3,y3,OLDx3, OLDy3);
  stroke(r4, g4, b4);
  line(x4,y4,OLDx4, OLDy4);

  //save old points for backup
  OLDx1 = x1;
  OLDy1 = y1;
  OLDx2 = x2;
  OLDy2 = y2;
  OLDx3 = x3;
  OLDy3 = y3;
  OLDx4 = x4;
  OLDy4 = y4;
  }
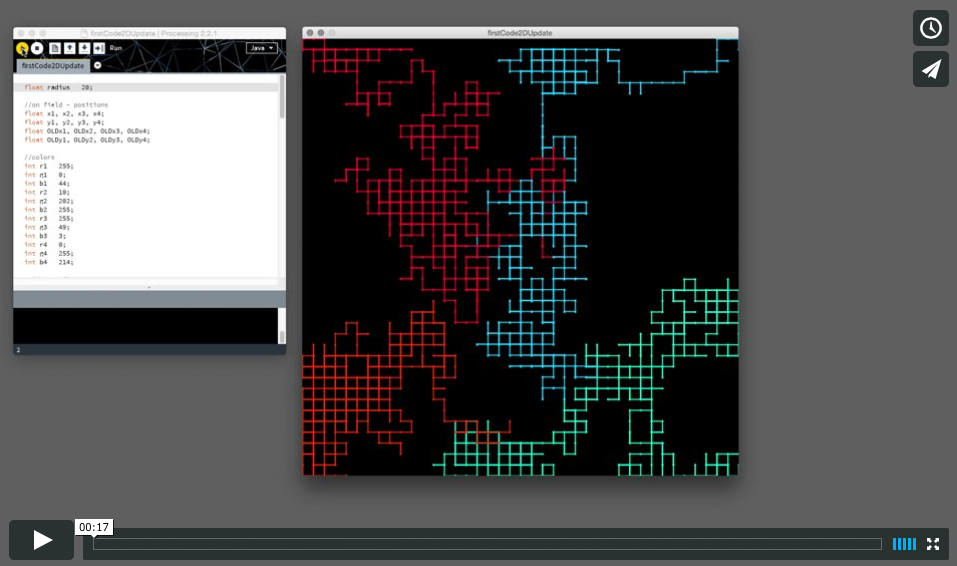
Although I was pretty proud of my first solution I still didn't find it visually attractive all times you started it. The colors where to random, and often didn't fit to each other, so I decided to specify four colors. Also I found out that the occuring pictures often looked better, when the starting points of the four colors where in the edges. After some rework time, my code Looked like this:
The final 2D Version:
  float radius = 30;

  //on field positions
  float x1, x2, x3, x4;
  float y1, y2, y3, y4;
  float OLDx1, OLDx2, OLDx3, OLDx4;
  float OLDy1, OLDy2, OLDy3, OLDy4;

  //colors
  int r1 = 255;
  int g1 = 0;
  int b1 = 44;
  int r2 = 10;
  int g2 = 202;
  int b2 = 255;
  int r3 = 255;
  int g3 = 49;
  int b3 = 3;
  int r4 = 0;
  int g4 = 255;
  int b4 = 214;

  void setup(){
  size(800,800);
  background(0);
  x1 = x3 = 0;
  x2 = x4 = width;
  y1 = y2 = 0;
  y3 = y4 = height;
  OLDx1 = OLDx3 = x1;
  OLDx2 = OLDx4 = x2;
  OLDy1 = OLDy2 = y1;
  OLDy3 = OLDy4 = y3;
  frameRate(60);
  }


  void draw()
  {

  //define new angle
  float angle =(TWO_PI/4) * floor(random(-4,4));
  x1 += cos(angle)*radius;
  y1 += sin(angle)* radius;
  angle =(TWO_PI/4) * floor(random(-4,4));
  x2 += cos(angle)*radius;
  y2 += sin(angle)* radius;
  angle =(TWO_PI/4) * floor(random(-4,4));
  x3 += cos(angle)*radius;
  y3 += sin(angle)* radius;
  angle =(TWO_PI/4) * floor(random(-4,4));
  x4 += cos(angle)*radius;
  y4 += sin(angle)* radius;

  //prohibit offscreen points
  if (x1<0 || x1>width || y1<0 || y1>width){
  x1 = OLDx1;
  y1 = OLDy1;
  }
  if (x2<0 || x2>width || y2<0 || y2>width){
  x2 = OLDx2;
  y2 = OLDy2;
  }
  if (x3<0 || x3>width || y3<0 || y3>width){
  x3 = OLDx3;
  y3 = OLDy3;
  }
  if (x4<0 || x4>width || y4<0 || y4>width){
  x4 = OLDx4;
  y4 = OLDy4;
  }

  //draw lines
  strokeWeight(2);
  stroke(r1, g1, b1);
  line(x1,y1,OLDx1, OLDy1);
  stroke(r2, g2, b2);
  line(x2,y2,OLDx2, OLDy2);
  stroke(r3, g3, b3);
  line(x3,y3,OLDx3, OLDy3);
  stroke(r4, g4, b4);
  line(x4,y4,OLDx4, OLDy4);

 //set angle points
  strokeWeight(4);
  stroke(r1, g1, b1);
  point(x1,y1);
  stroke(r2, g2, b2);
  point(x2,y2);
  stroke(r3, g3, b3);
  point(x3,y3);
  stroke(r4, g4, b4);
  point(x4,y4);

  //save old points for backup
  OLDx1 = x1;
  OLDy1 = y1;
  OLDx2 = x2;
  OLDy2 = y2;
  OLDx3 = x3;
  OLDy3 = y3;
  OLDx4 = x4;
  OLDy4 = y4;
  }
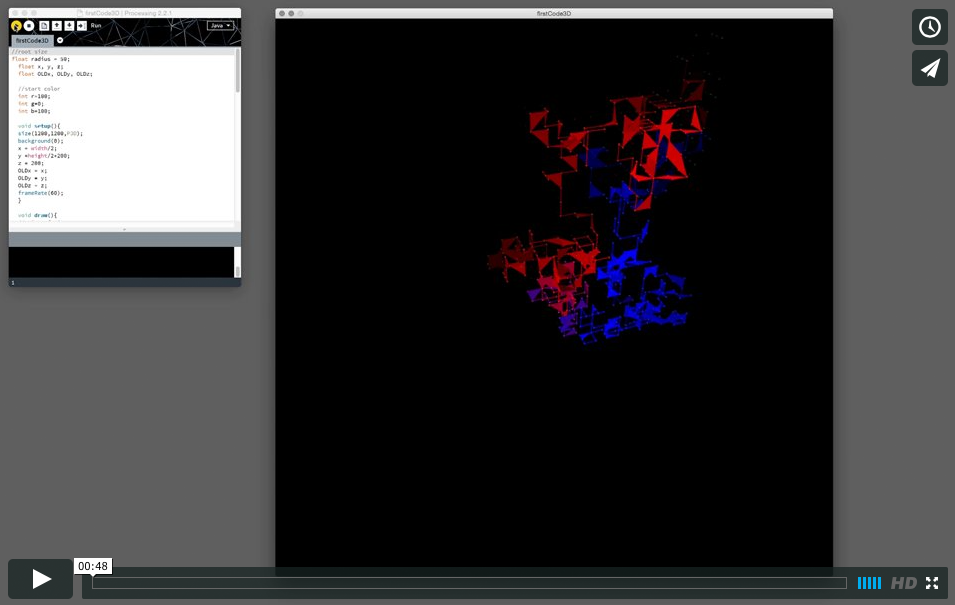
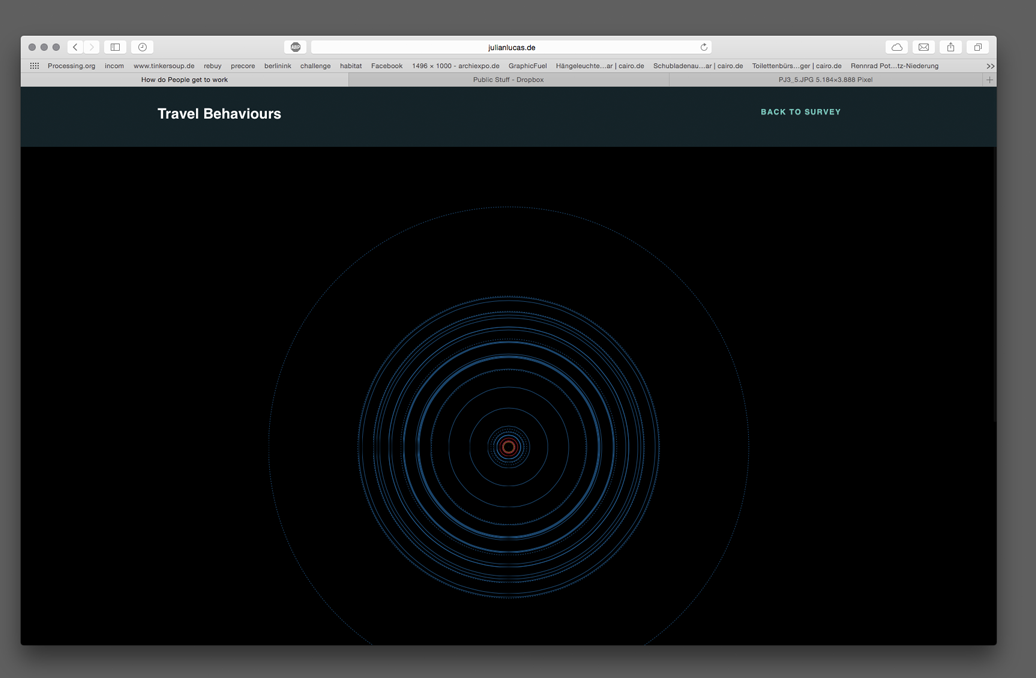
My 2D solution was now done, and as you would eventually now spaculate, I took the opportunity to built a 3D Version.
In the threedimensional solution decreased the lines to 1 single line, after I recognized, that 4 lines would be way to much to differenciate because the third dimension gave the construct a pretty high amount of visual complexity compared to the erlier version.
For an improved visual clarity I developed a kind of 3rd-dimension color: As the line moves in the z-dimension, the color gets warmer (nearer) and colder (further). The color scheme ranges from dark blue to red.
The final 3D Version:
//root size
float radius = 50;
  float x, y, z;
  float OLDx, OLDy, OLDz;

  //start color
  int r=100;
  int g=0;
  int b=100;

  void setup(){
  size(1200,1200,P3D);
  background(0);
  x = width/2;
  y =height/2+200;
  z = 200;
  OLDx = x;
  OLDy = y;
  OLDz = z;
  frameRate(60);
  }

  void draw(){
  //point of view
  rotateX(-0.7);
  rotateY(0.34);

  //draw
  fill(r,g,b);
  stroke(r+50,g+50,b+50);
  strokeWeight(4);
  point(x,y,z);
  stroke(r,g,b);
  strokeWeight(2);
  beginShape();
  vertex(OLDx,OLDy,OLDz);
  vertex(x, y, z);

  //backup old values
  OLDx = x;
  OLDy = y;
  OLDz = z;

  //define new x, y, z
  int q = (int)random(12);
  if(q==1){
  x = x+radius;
  }
  if(q==2){
  x = x-radius;
  }
  if(q==3){
  y = y+radius;
  }
  if(q==4){
  y = y-radius;
  }
  if(q==5){
  z = z+radius/2;
  r=r+30;
  b = b-30;
  }
  if(q==6){
  z = z-radius;
  b=b+30;
  r = r-30;
  }

  //prohibit vertex to run out of screen
  if(y<0 || y>height||x<0 || x>width||z<0 || z>height/4){
  y = OLDy;
  x = OLDx;
  z = OLDz;

  //prohibit colorvalue to run out of range
  }
  if(r>255){
  r=255;
  }
  if(b>255){
  b=255;
  }

  vertex(x, y, z);
  endShape();
  point(x,y);
  if(mousePressed){saveFrame();}
}
FINISH
For the final presentation we also had the exercise to find an application for our programmed algorythm. This could be in form of an object or a 2D print. The goal was to get the code into the real world again, after we transfered it in computer-understandable language.
I had the Idea to use the pattern generated in the 2D-Version in my Code to integrate it in a Lamp. First I built a construct with wood, which was drilled and then interwoven with fishing line. Then I used wool to generate the pattern in the with boulter generated network.
At the end I covered the free areas with black carton and recessed a lightbulb and composure.

©Julian Lucas Wohlleber

Erster Kontakt mit Html, java Script. Eine Visualisierung der Daten einer Online-Umfrage.
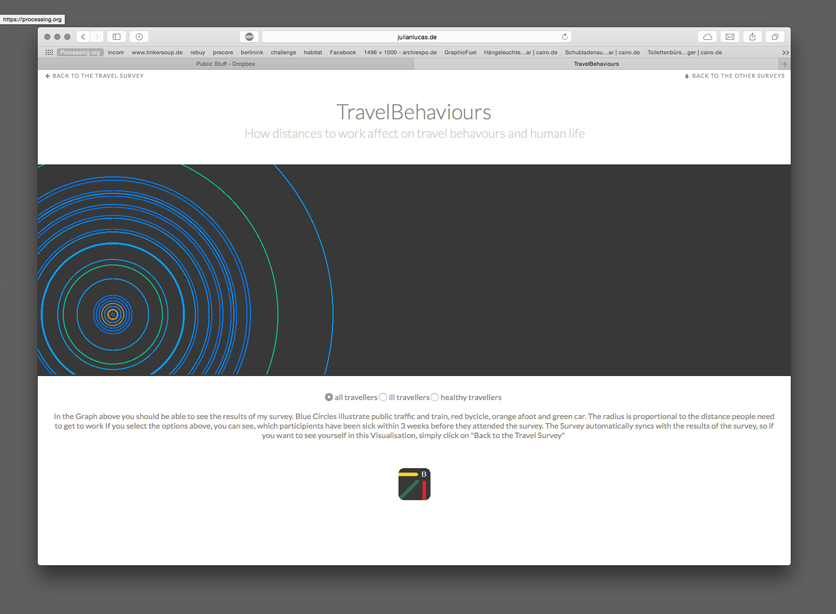
This was probably one of the hardest task, I had in this course. The task was to generate Data and do a Datavisualisation with it, which should later be published on a Webpage online.
IDEA
After some time thinking, I decided to generate a Survey about the daily travel distances and their impact on the transportation-method and the effects of health. I generated the Survey with Google Survey, because Google Survey offers the best ways to publish the generated data, which later was really relevant for the built of the Html-Page.
Get to the Survey.
REALISATION - Website 1.0
When I started to write the Webpage, I first was really really lost. I never had made any experience before with html, much less I had never heard of css. The only thing that I understood a little was java script with the help of p5, which is a library that makes java script feel and work pretty similar to processing. When I succeeded after a few hours to built a Webpage like I wanted it (Html only, no Java Script, precasted css), I decided to start with the java script part. After hours of work, I had... yeah - actually still nothing. I simply didn't understand arrays, and how I could use the contend of the google spreadsheet in my code. After some more time struggeling I felt really low, and decided to just built the Visualisation manually with Illustrater, export the document as a PDF and and just implement that into my webpage. I wasn't really proud of this solution, but I just didn't had the time to finish it properly.
Finish
When my vacation started and I had done all my dokus for my other subjects, I decided to finish what I started so far. After an 8-hour-youtube-course I understood the basics of java script. I could now use arrays, link a java script into html, link buttons of a html page to java script (after some time of practise), and after some more hours of research was able to use the data of the online spreadsheet via tabletop.
I searched for a nice css, built the html page, and after a lot of time, also finished the java script.
I'm really proud that I've built my first Webpage, and I'm happy, that I invested so much time, because coding seems to be like reading or writing. Once you've learned something, you do not forget it, or at least learn it fast again.
There are still some issues I had with the page, for example that I wasn't able to fit the Canvas into the window-width, which sometimes generates unlovely grades between the html section and the canvas, but I think I should be able to fix this in some time.
 )
)Ein Physical-Computing Projekt mit einem Arduino Uno. Ein Sachverhalt in der Natur soll gemessen und auf einen binären Zustand heruntergebrochen werden, der mit einem Flipdot ausgegeben werden soll.
Since humen exist they affect on their environment. One of the resulting effects is that animal species like the Galapagos tortoise extinct.
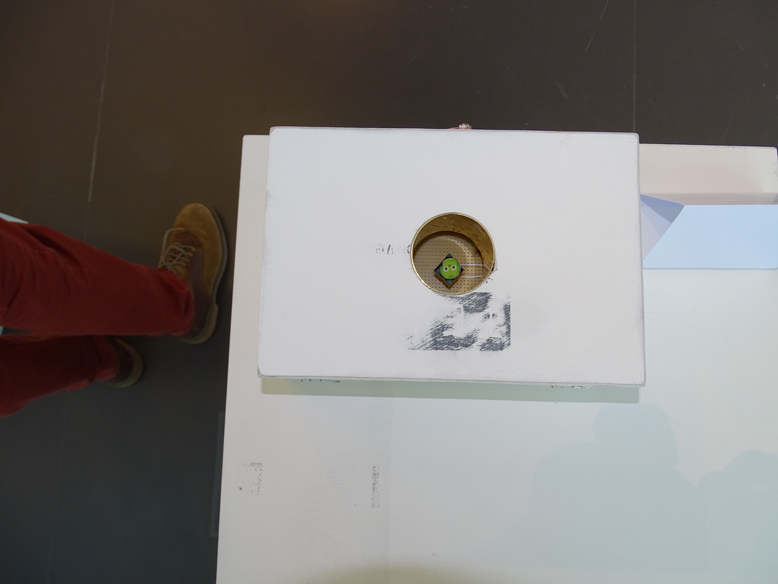
My flipdotwork faces this issue and breaks it down into two binary states; the moment you're sharing area with animals you're taking impact on their daily behaviour. This is why progress for humen often means regress for nature.
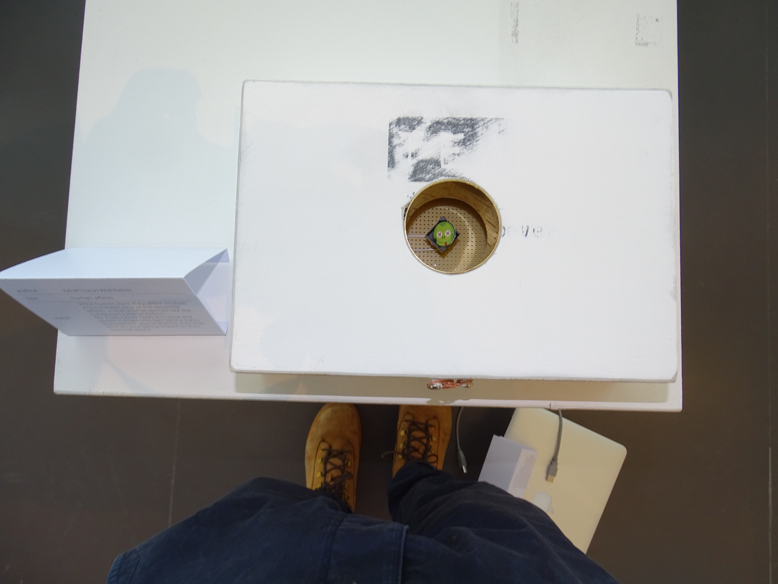
In my flipdotwork I equated this circumstance with a simple step forward - as the spectator steps forward and verges the object, the tortose sitting in its recess in the box dies.
IDEA
When I started to realize my project, my first idea was to use facedetection with the help of the simple cv library and the raspberry pi with a usb web-cam. The goal was to make a task for the spectator which was impossible to solve: Face the text on the Flipdot and read it. At the moment, the spectator would look at the dot, the dot would flip. The spectator would realize there is something written on the dot, but each time he would try to face it, it would disappear.
Unfortunatly the facedetection of simple cv was to inaccurate: As the head was tilted, no face was detected anymore. Another Problem was, that the raspberry Pi was way too slow to interpret the pictures that came from the usb cam via simple cv. It wouldve been too easy to trick out the system, so the whole charm of my project would've been lost.
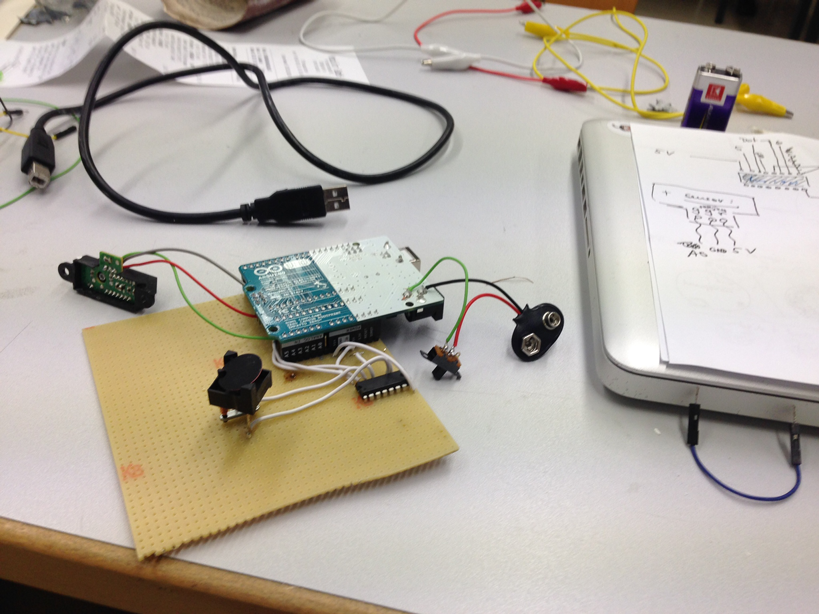
Thats why I decided to look for new Hardware that would solve my Problem. As a simple but good solution i found the analog sharp IR distance sensor Sharp GP2Y0A21. This sensor also enabled me, to use the arduino board for this project.
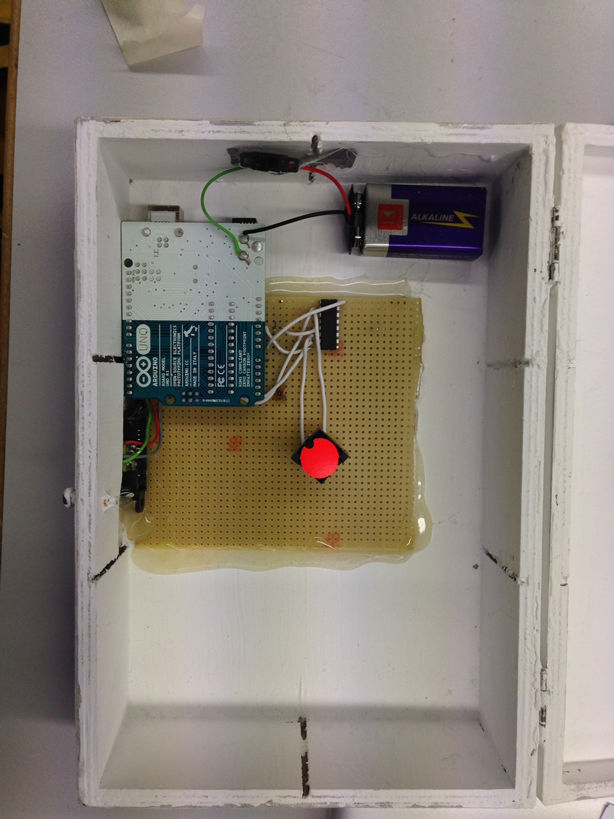
REALISATION - Software
Because the distance sensor measures nothing but distance, I decided to place a recess in the box the hardware would be in. In this recess the flipdot would be located, so that the spectator needs to come closer to see the flipdot.
At the beginning i tried to write the code completely on my own. But a Problem appeared: The distance sensor gave out completely different values with analogRead() on each launch. So sometimes the values were accurate enough to detect an approach but often also not.
That's were I want to give a special thanks to Phillip Pfingsttag, who gave me the DistanceGP2Y0A21YK-library as well as a nice and organised presentation and explanation of Sharp-Distance sensors and also a thanks to Fabian Morón Zirfas who arranged this meeting.
The DistanceGP2Y0A21YK-library enabled my distance sensor not only to detect objects or persons but also to measure the distance between the object and the sensor itsself. That gave me even more possibilities. After some time of coding and testing, i decided, that 30 cm were the perfect distance for my project.
The final code looks like this:
// Sharp IR GP2Y0A21YK Distance Test

#define sensor 0 // Sharp IR GP2Y0A21YK (10-80cm, analog)

//dot position
int read_on = 6;
int read_off = 5;

//minimal distance to flip
int maxdistance = 30;

boolean state = true;

void setup() {
Serial.begin(9600); // start the serial port
}

void loop() {

 // 5v - Read Sensor
float volts = analogRead(sensor)*0.0048828125;  // value from sensor *  (5/1024)
int distance = 28*pow(volts, -1); // worked out from datasheet graph
//delay(100); // slow down serial port


//flip dot position 1
if (distance <= maxdistance && distance > 0 && state == true){
    digitalWrite(read_on, LOW);
    digitalWrite(read_off, HIGH);
    Serial.print("flop");
    state = false;
}

//flipdot position 2
if((distance > maxdistance || distance == 0) && state == false){
    digitalWrite(read_on, HIGH);
    digitalWrite(read_off, LOW);
    Serial.print("flip");
    state = true;
}

delay(20);
digitalWrite(read_off, LOW);
digitalWrite(read_off, LOW);
Serial.println(distance);
Serial.print(state);
delay(200);
}
REALISATION - Hardware
Until this point my project was a hardware-prototype: Everything was just connected barely on the breadboard of my teensy kit. Thats why I decided to solder everything to a plate to built a stable and by transportation unaffected circuit.
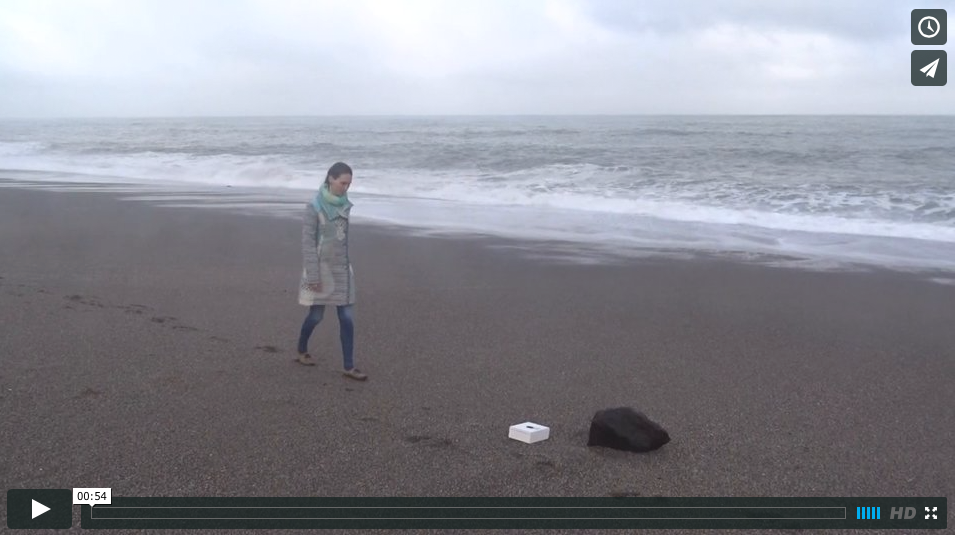
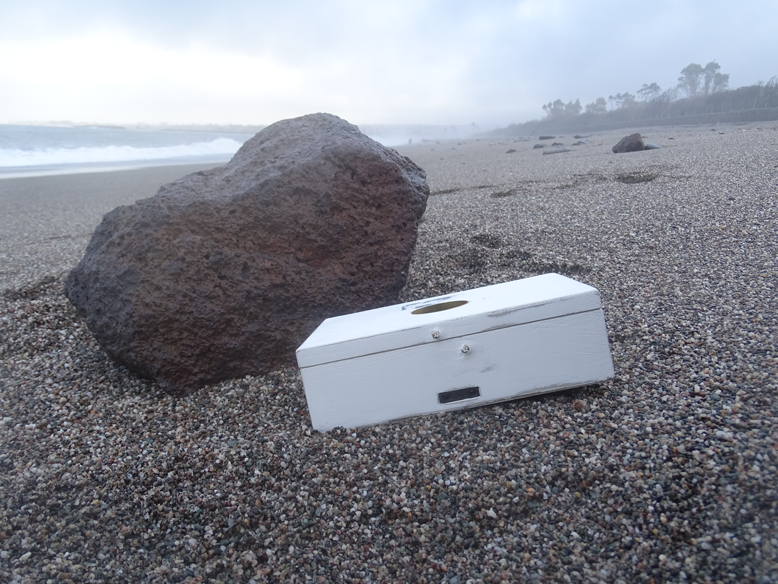
For the wrapping i used a tee box, which was painted white and later grinded for a used look. I wanted my object to look like it was just washed ashore from the see.
On the top of the box i drilled a huge whole where i recessed a brass pipe. On the bottom of the pipe the Flipdot should be located, so that the spectator should not see the inside of the box, but the Flipdot and its surrounding area.
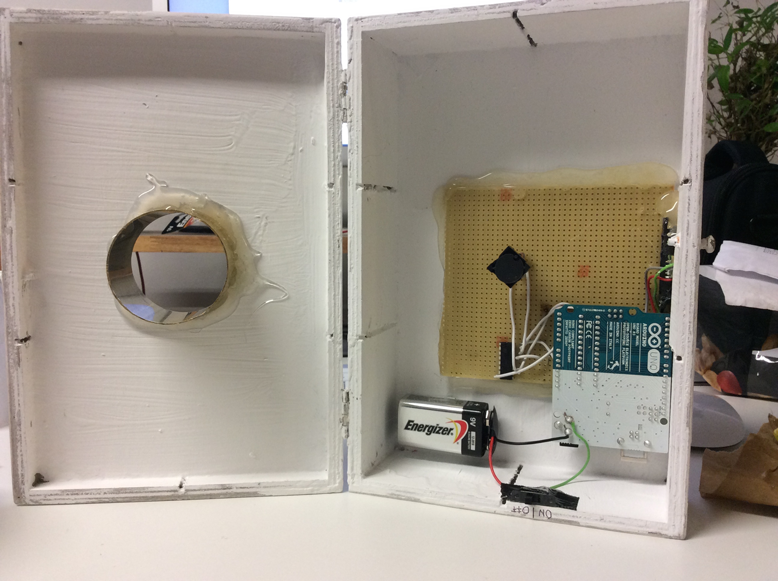
The Sharpsensor was recessed in the front of the box, so that it would recognize an approaching person.
FINISH
The plan was to extend the flipdot area, so that a text could've been written next to the tortoise.
Unfortunatly the Flipdot was to weak to flip an extension, why i was limited to the flipdot area.
The Video was recorded in Sicily with the help of my girlfriend Annette Münzenmaier. Then it was cut with the help of Final Cut Pro, and uploaded to vimeo.
Ein Projekt von
 Julian Lucas Wohlleber
Fachgruppe
GestaltungsgrundlagenArt des Projekts
Studienarbeit im ersten Studienabschnitt
Betreuer_in
Fabian Morón Zirfas
Zugehöriger Workspace
Eingabe Ausgabe - Grundlagen der Prozessorientierten GestaltungEntstehungszeitraum
Wintersemester 2014 / 2015